afrimapr interactive apps
We develop interactive apps to facilitate data visualisation using the R package, Shiny. All applications are open-source and have links to their respective source code.
Below you can find some demo interactive apps that we have developed for various projects.
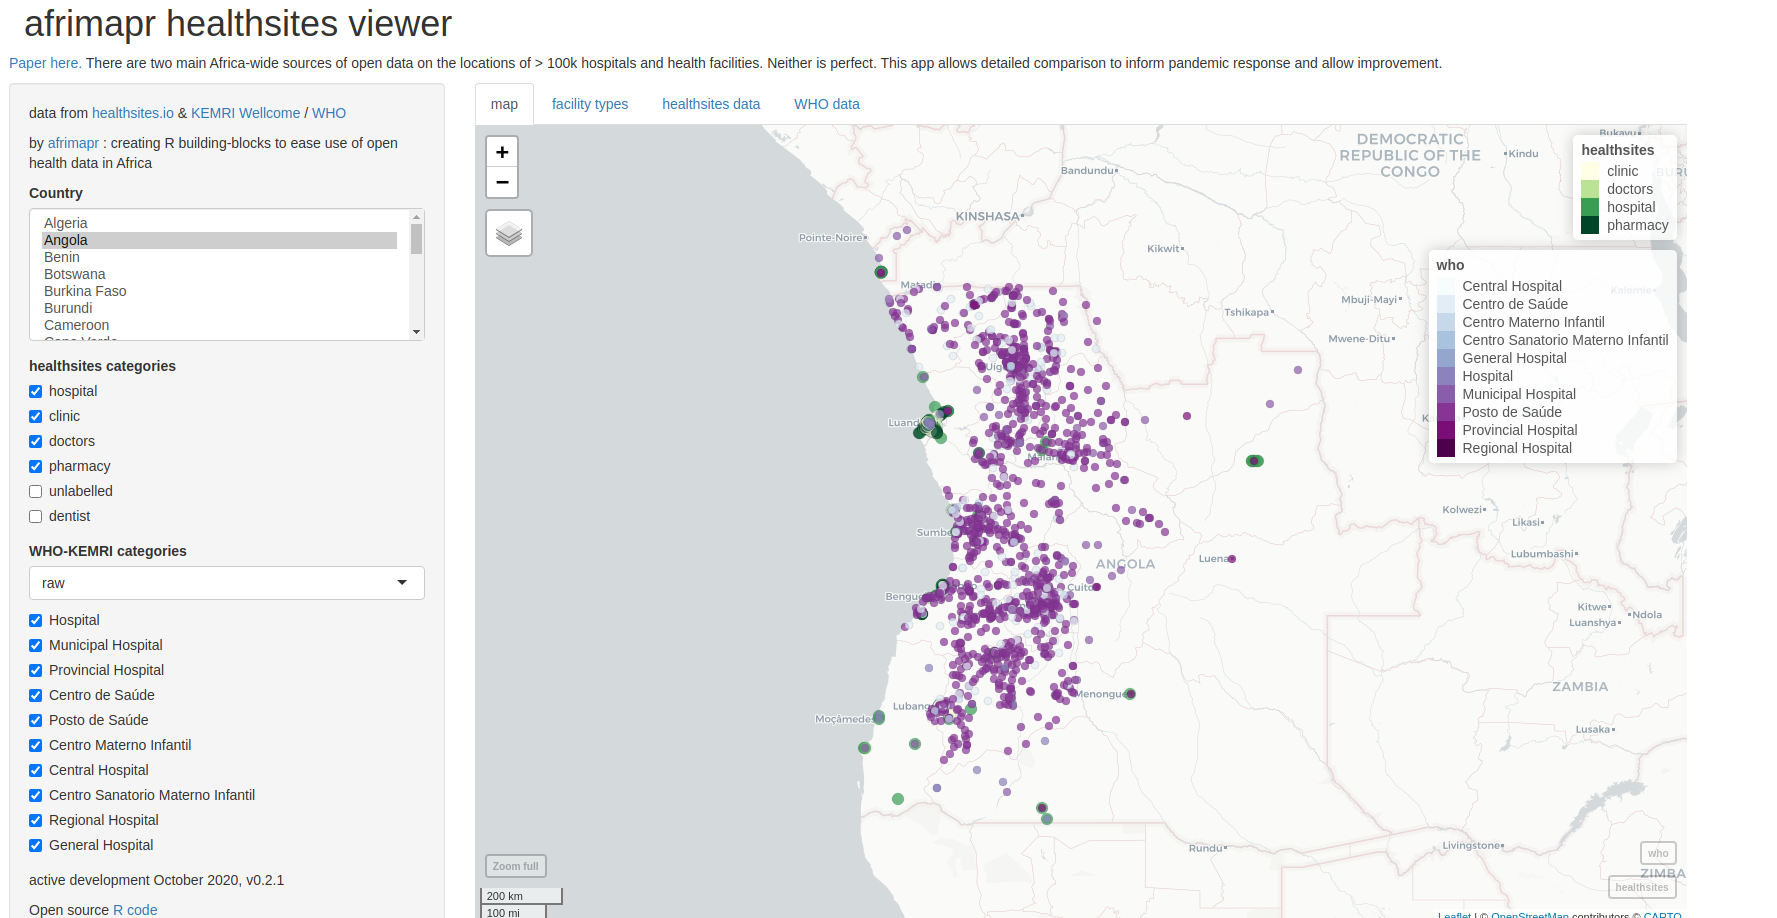
The afrihealthsites viewer makes it easier to access and compare open health facility data for Africa from WHO-KWTRP and healthsites.io (and potentially others in future). This currently contains around 96k locations from the WHO-KEMRI dataset and 57k locations from healthsites.io.
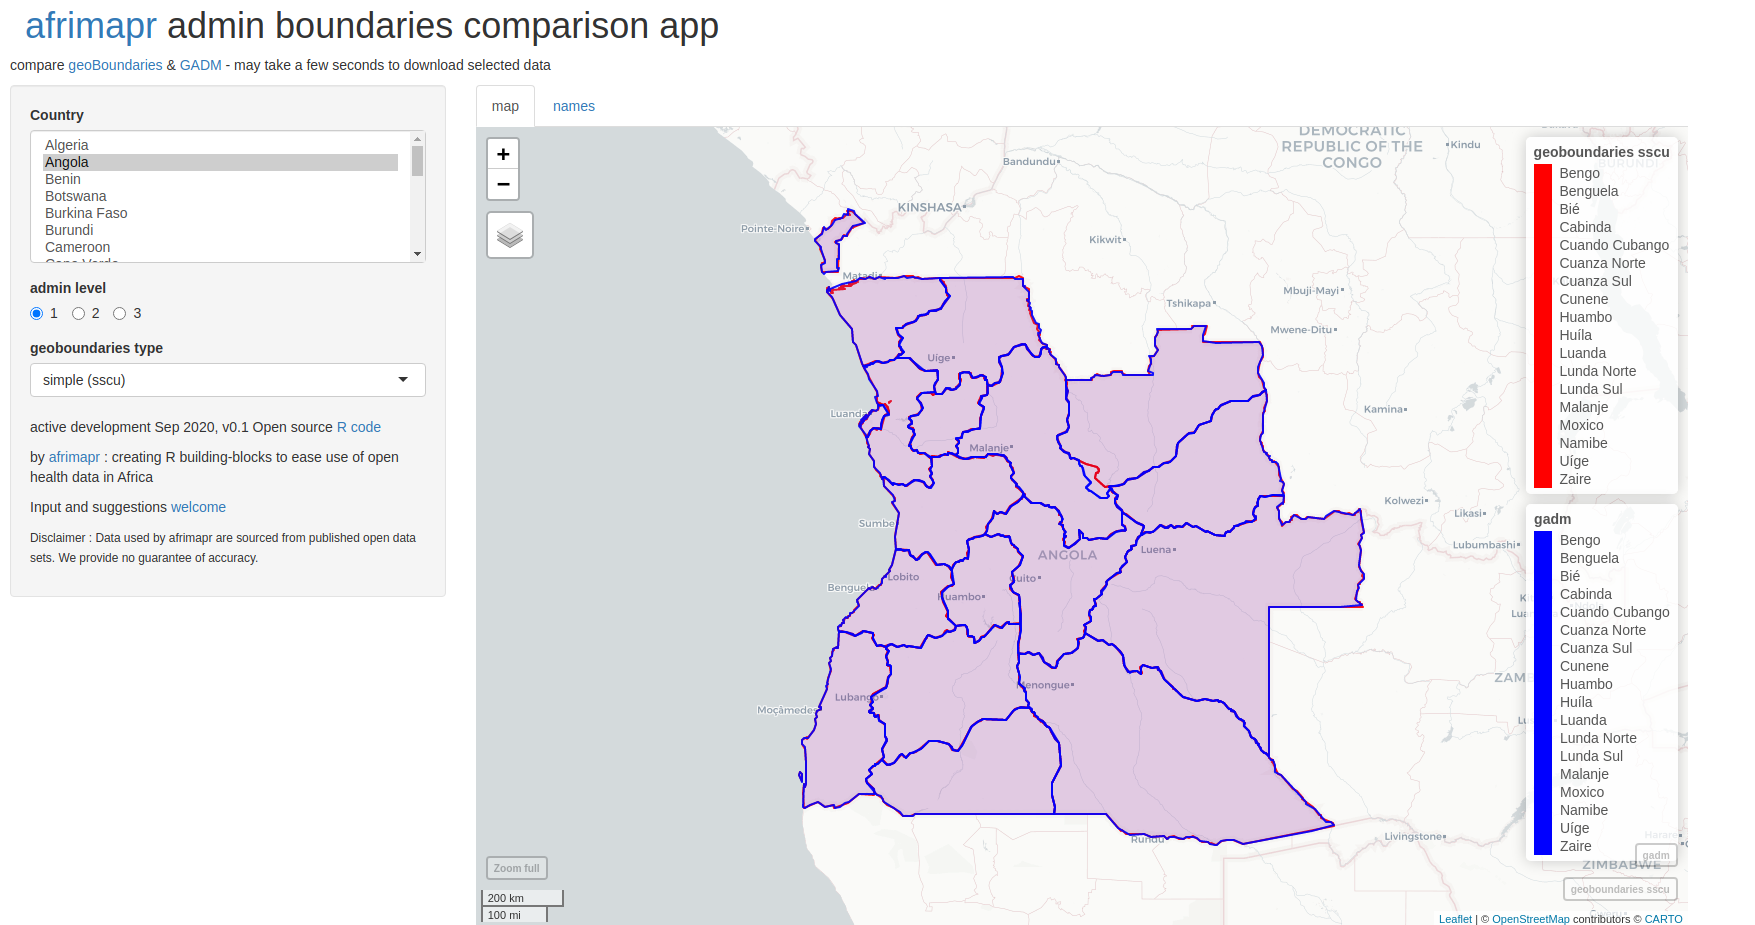
The motivation for the afriadmin package (in early development) is to ease access to different data sources for users and help them choose which is the best for their needs.
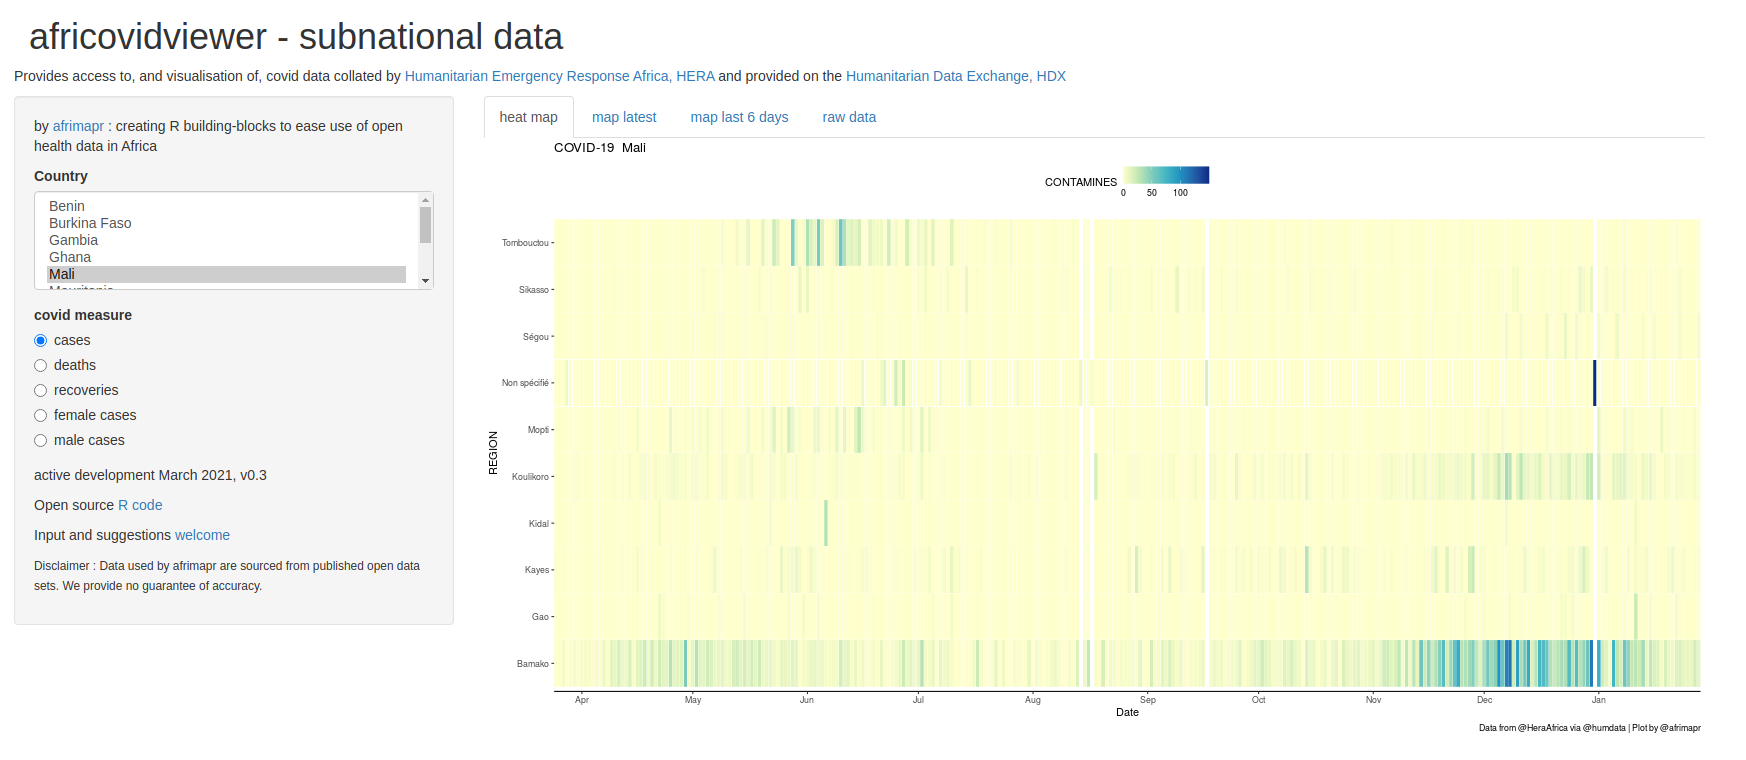
This prototype provides access to, and visualisation of, COVID-19 data collated by Humanitarian Emergency Response Africa (HERA) and provided on the Humanitarian Data Exchange (HDX).
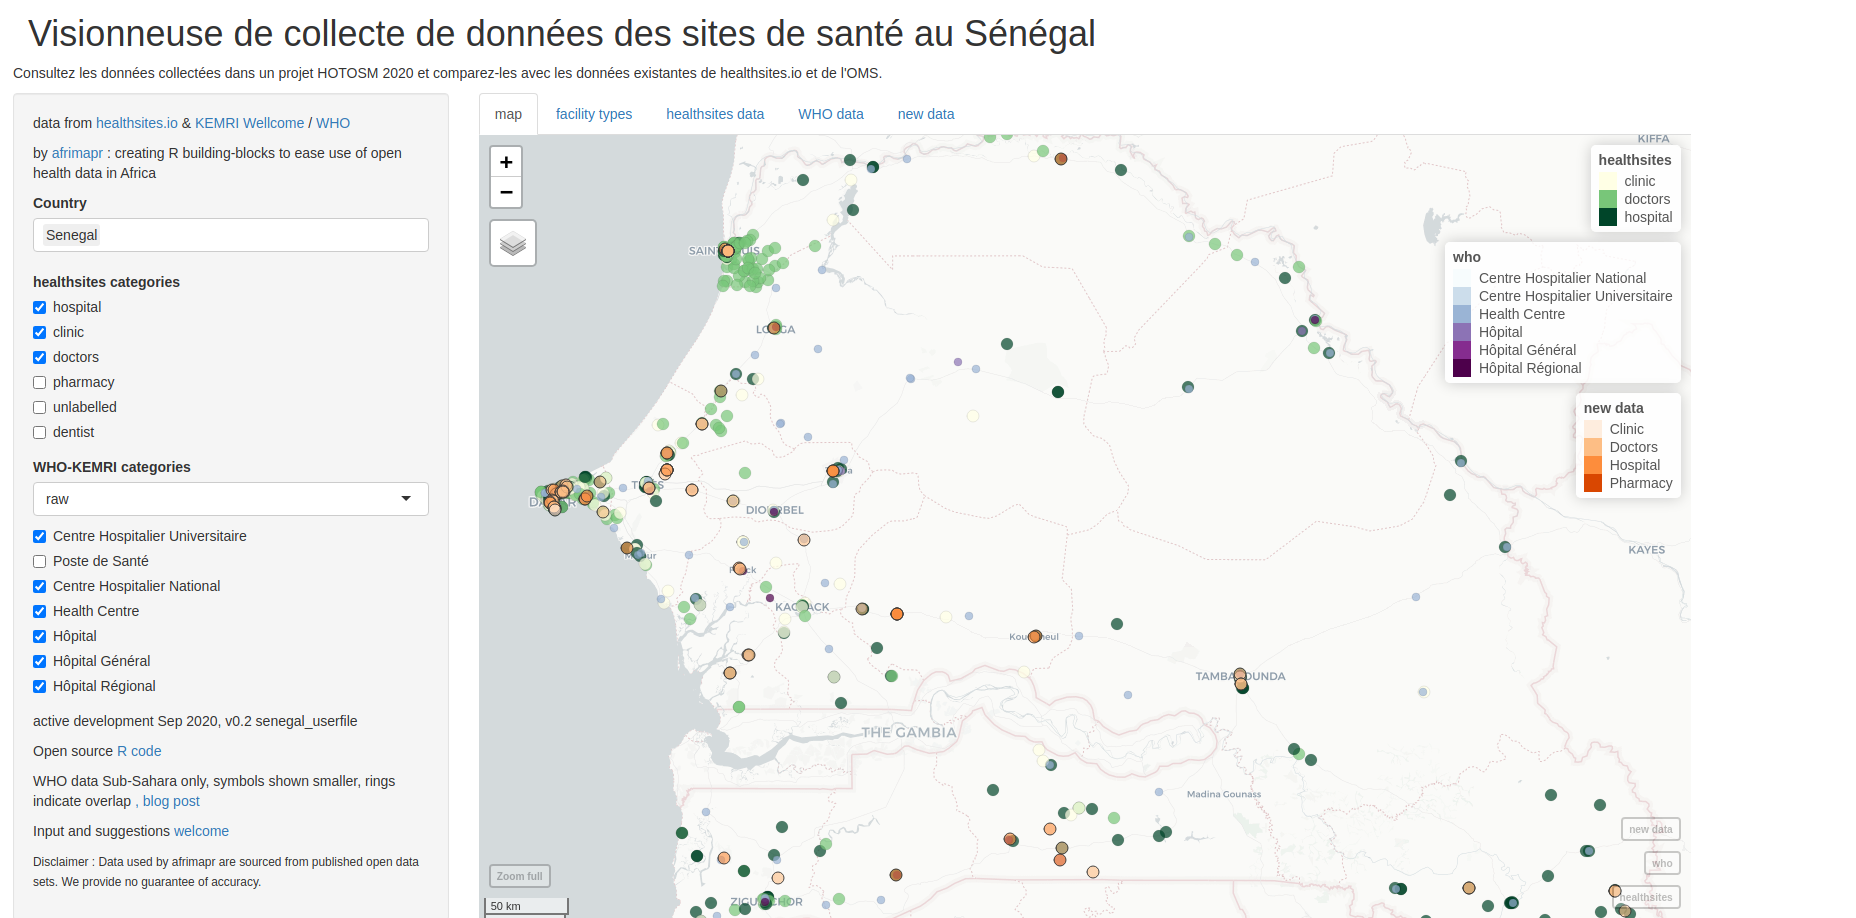
The afrihealthsites app was used to visualise the change in data during a data collection effort around emergency health services available at hospitals in Senegal in 2020.
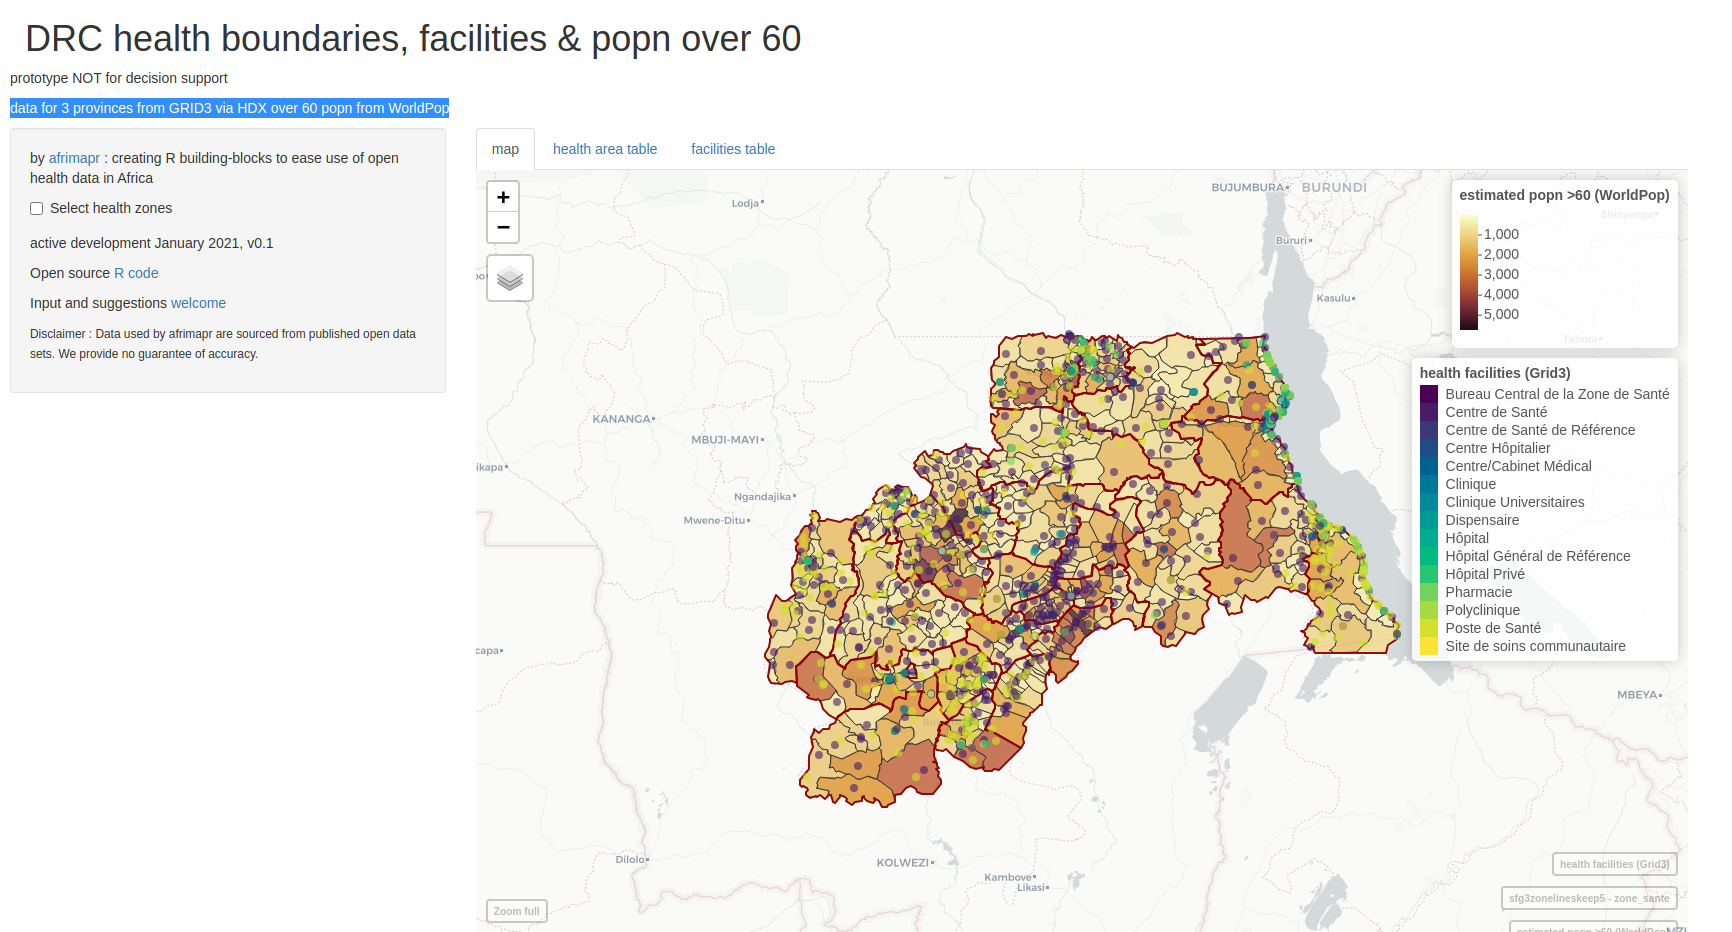
This prototype provides access to health facility data for three provinces from GRID3 via HDX and population over 60 years from WorldPop.
